IPython’s Data Publication API#
IPython has an API that allows IPython Engines to publish data back to the Client. This Notebook shows how this API works.
Setup#
We begin by enabling matplotlib plotting and creating a Client object to work with an IPython cluster.
%matplotlib inline
import ipyparallel as ipp
c = ipp.Client()
dv = c[:]
dv.block = False
dv
<DirectView [0, 1, 2, 3]>
Simple publication#
Here is a simple Python function we are going to run on the Engines. This function uses publish_data to publish a simple Python dictionary when it is run.
def publish_it():
    from ipyparallel.datapub import publish_data

    publish_data(dict(a='hi'))
We run the function on the Engines using apply_async and save the returned AsyncResult object:
ar = dv.apply_async(publish_it)
The published data from each engine is then available under the .data attribute of the AsyncResult object.
ar.data
[{}, {}, {}, {}]
Each time publish_data is called, the .data attribute is updated with the most recently published data.
Simulation loop#
In many cases, the Engines will be running a simulation loop and we will want to publish data at each time step of the simulation. To show how this works, we create a mock simulation function that iterates over a loop and publishes a NumPy array and loop variable at each time step. By inserting a call to time.sleep(1), we ensure that new data will be published every second.
def simulation_loop():
    import time

    import numpy as np

    from ipyparallel.datapub import publish_data

    for i in range(10):
        publish_data(dict(a=np.random.rand(20), i=i))
        time.sleep(1)
Again, we run the simulation_loop function in parallel using apply_async and save the returned AsyncResult object.
ar = dv.apply_async(simulation_loop)
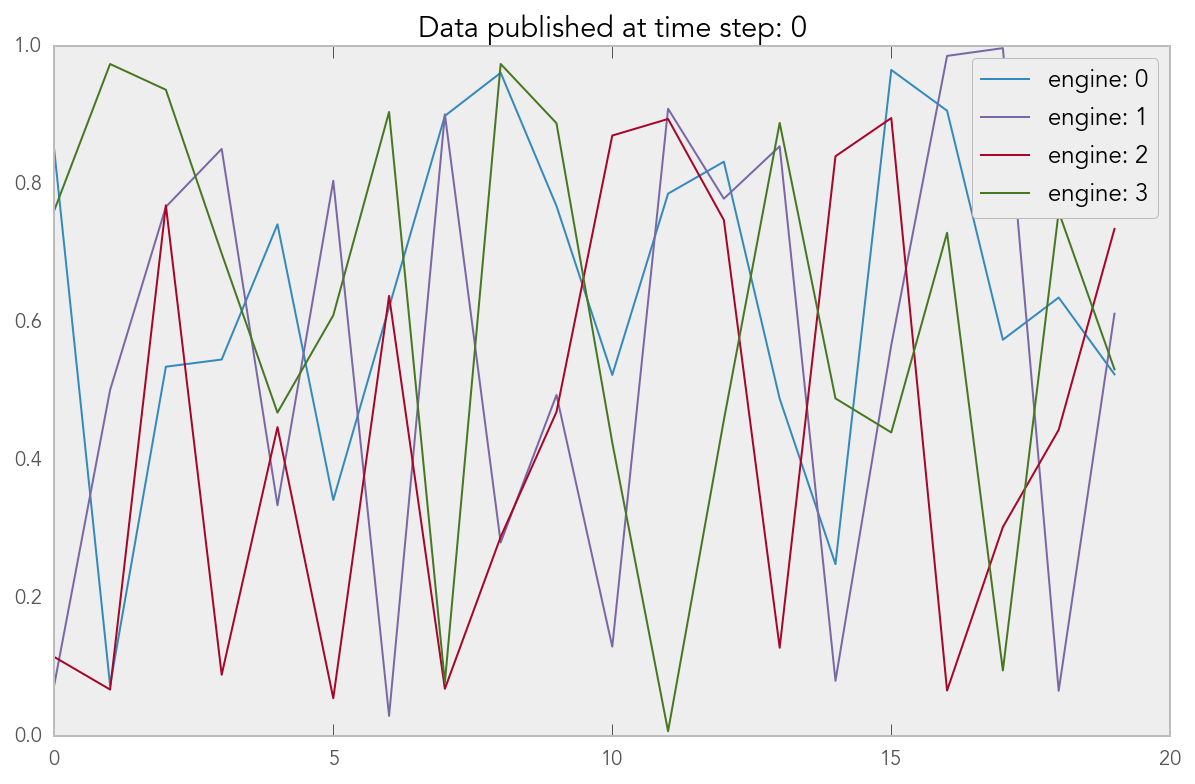
New data will be published by the Engines every second. Anytime we access ar.data, we will get the most recently published data.
import matplotlib.pyplot as plt
data = ar.data
for i, d in enumerate(data):
    plt.plot(d['a'], label='engine: ' + str(i))
plt.title('Data published at time step: ' + str(data[0]['i']))
plt.legend()
<matplotlib.legend.Legend at 0x105f75b00>