IPython’s Data Publication API
IPython has an API that allows IPython Engines to publish data back to the Client. This Notebook shows how this API works.
Setup
We begin by enabling matplotlib plotting and creating a Client object to work with an IPython cluster.
[1]:
%matplotlib inline
[2]:
import ipyparallel as ipp
[3]:
c = ipp.Client()
dv = c[:]
dv.block = False
dv
[3]:
<DirectView [0, 1, 2, 3]>
Simple publication
Here is a simple Python function we are going to run on the Engines. This function uses publish_data to publish a simple Python dictionary when it is run.
[4]:
def publish_it():
    from ipyparallel.datapub import publish_data
    publish_data(dict(a='hi'))
We run the function on the Engines using apply_async and save the returned AsyncResult object:
[5]:
ar = dv.apply_async(publish_it)
The published data from each engine is then available under the .data attribute of the AsyncResult object.
[6]:
ar.data
[6]:
[{}, {}, {}, {}]
Each time publish_data is called, the .data attribute is updated with the most recently published data.
Simulation loop
In many cases, the Engines will be running a simulation loop and we will want to publish data at each time step of the simulation. To show how this works, we create a mock simulation function that iterates over a loop and publishes a NumPy array and loop variable at each time step. By inserting a call to time.sleep(1), we ensure that new data will be published every second.
[7]:
def simulation_loop():
    from ipyparallel.datapub import publish_data
    import time
    import numpy as np
    for i in range(10):
        publish_data(dict(a=np.random.rand(20), i=i))
        time.sleep(1)
Again, we run the simulation_loop function in parallel using apply_async and save the returned AsyncResult object.
[8]:
ar = dv.apply_async(simulation_loop)
New data will be published by the Engines every second. Anytime we access ar.data, we will get the most recently published data.
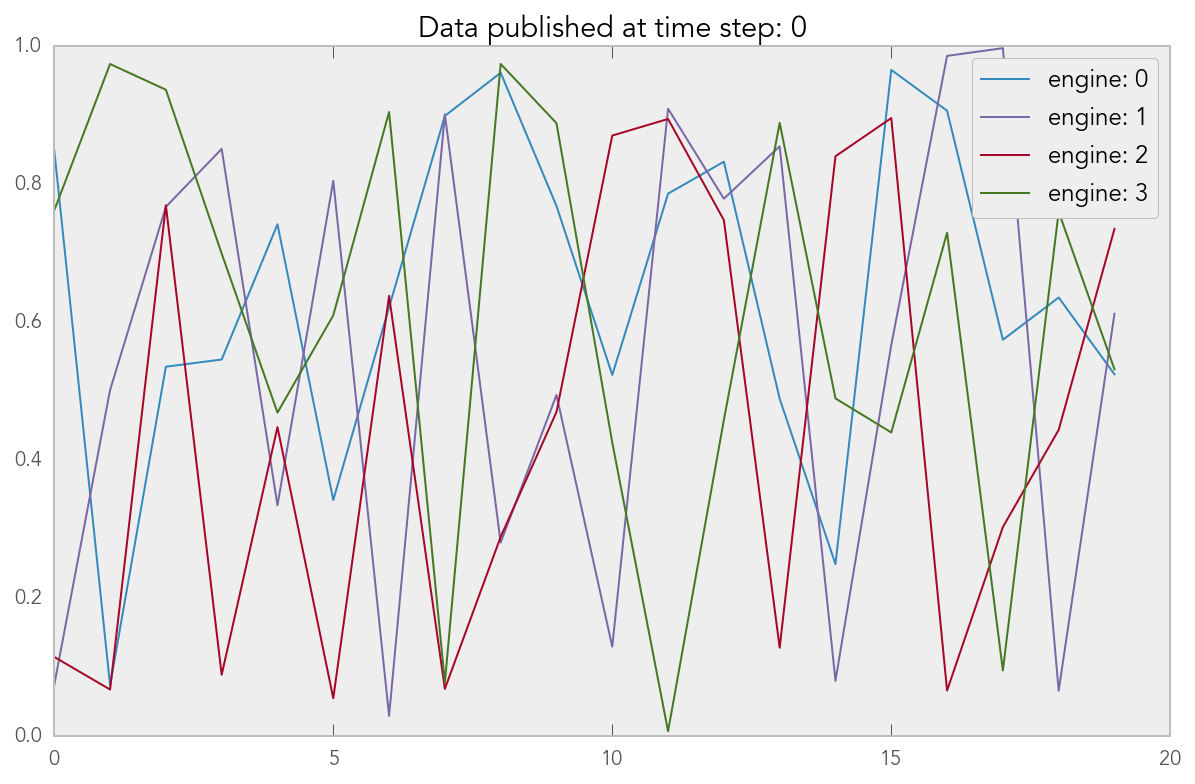
[9]:
import matplotlib.pyplot as plt
[10]:
data = ar.data
for i, d in enumerate(data):
    plt.plot(d['a'], label='engine: '+str(i))
plt.title('Data published at time step: ' + str(data[0]['i']))
plt.legend()
[10]:
<matplotlib.legend.Legend at 0x105f75b00>